Exercise 7 (demo) - Gliders in the Baltic#
Aim: To see a different platform in action, collecting CTD (and other data). The example dataset chosen here also has some “issues”, so you can also see whether you can find a way to plot the data to display the issue.
Data: You will work with data from Voice of the Ocean (VOTO) collected in the Baltic Sea.
Directions: Run the python code step by step, and use it to download some data, make some starter plots, and then add some additional plots at the end yourself.
Update your environment#
Your environment will need to contain:
matplotlib
pandas
tqdm
xarrray
cmocean
erddapy
argopy
This means you will probably need to add tqdm, erddapy and argopy.
Note
If you’re using conda to manage your environment: If these aren’t all already in your environment, and you’re using conda to manage your enviroment, then you can first activate your environment (mine is called seaocn_env), then you can run
If you aren’t using conda: Then you can simply install the missing packages using your usual routines (may be pip install erddapy)
You may need to restart your kernal and/or jupyter-lab in order to run with the new packages in your kernel.
import matplotlib.dates as mdates
from matplotlib import style
import matplotlib
import pandas as pd
import numpy as np
import matplotlib.pyplot as plt
import matplotlib.patches as patches
import ast
import datetime
from tqdm import tqdm
import xarray as xr
from cmocean import cm as cmo
import sys
1. ERDDAP-How to access data#
We need some functions in order to download data from ERDDAP. You will get these from erddap_demo which can be found here: voto-ocean-knowledge/erddap_demo
Use git clone to get this on your computer and the adjust the path in order to import all the functions OR just download the one file utils.py from the repository.
Warning!
After doing this, I’ve renamed it on my computer to erddaputils.py since utils.py is a fairly common package name, and I wanted to make sure I was importing the right file.
See also
Observations Observations portal VOTO https://observations.voiceoftheocean.org/
#sys.path.append('C:\\Users\\u241346\\uni_hamburg\\erddap_demo')

# Update the line below to specify where `erddaputils.py` can be found OR put it in your working directory.
sys.path.append('/Users/eddifying/Library/Mobile Documents/com~apple~CloudDocs/Work/teaching/SeaOcn-UHH/2024-SeaOcn/05-github/erddap_demo')
import erddaputils as utils
Got an error?#
If you got an error trying to import utils (or after renaming, import erddaputils) it may be because the file is not available on your “path”. The “path” is all the places that python will search for the file. Update your path using sys.path.append OR move utils.py (or erddaputils.py) to your working directory. Or, if you haven’t already renamed utils.py from this github package, then try renaming it since your python may be trying to load a utils.py from somewhere else.
Note that when you copy it, you will want the actual code (if you open utils.py it should look like python code). If you have a bunch of stuff that looks like HTML (i.e., lines that start with < and end with >) then you haven’t copied the raw file when you downloaded it from the git repository, so try the download again.
2. Load metadata first#
In the next section, we will download the metadata for the VOTO data to find datasets we’re interested in. Even though we are only downloading meta data, this still takes a while (2-5 minutes). Wait until the pink progress bar has completed before continuing.
e = utils.init_erddap()

# Fetch dataset list of all dataset existing
e.response = "csv"
e.dataset_id = "allDatasets"
df_datasets = e.to_pandas(parse_dates=['minTime (UTC)', 'maxTime (UTC)'])

print(f"found {len(df_datasets)} datasets")
found 544 datasets
# drop the allDatasets row and make the datasetID the index for easier reading
df_datasets.set_index("datasetID", inplace=True)
df_datasets.drop("allDatasets", inplace=True)

# Get only nrt data (near real time) and not delayed as otherwise it would be very long for an intial data exploration
df_datasets = df_datasets[df_datasets.index.str[:3] == "nrt"]
ds_meta = {}
for dataset_id in tqdm(df_datasets.index):
    ds_meta[dataset_id] = utils.get_meta(dataset_id)
0%| | 0/211 [00:00<?, ?it/s]
0%|▏ | 1/211 [00:00<01:07, 3.12it/s]
1%|▍ | 2/211 [00:00<01:44, 2.01it/s]
1%|▌ | 3/211 [00:01<01:35, 2.17it/s]
2%|▊ | 4/211 [00:01<01:27, 2.36it/s]
2%|█ | 5/211 [00:02<01:44, 1.97it/s]
3%|█▏ | 6/211 [00:03<02:22, 1.44it/s]
3%|█▍ | 7/211 [00:04<02:47, 1.22it/s]
4%|█▋ | 8/211 [00:05<02:33, 1.32it/s]
4%|█▊ | 9/211 [00:06<03:19, 1.01it/s]
5%|█▉ | 10/211 [00:07<03:30, 1.05s/it]
5%|██▏ | 11/211 [00:09<03:57, 1.19s/it]
6%|██▍ | 12/211 [00:10<03:35, 1.08s/it]
6%|██▌ | 13/211 [00:11<03:28, 1.05s/it]
7%|██▊ | 14/211 [00:11<02:39, 1.24it/s]
7%|██▉ | 15/211 [00:11<02:13, 1.47it/s]
8%|███▏ | 16/211 [00:12<01:53, 1.72it/s]
8%|███▍ | 17/211 [00:12<01:42, 1.90it/s]
9%|███▌ | 18/211 [00:12<01:20, 2.39it/s]
9%|███▊ | 19/211 [00:13<01:18, 2.43it/s]
9%|███▉ | 20/211 [00:13<01:14, 2.56it/s]
10%|████▏ | 21/211 [00:13<01:14, 2.54it/s]
10%|████▍ | 22/211 [00:14<01:14, 2.52it/s]
11%|████▌ | 23/211 [00:14<01:16, 2.45it/s]
11%|████▊ | 24/211 [00:15<01:32, 2.01it/s]
12%|████▉ | 25/211 [00:15<01:25, 2.17it/s]
12%|█████▏ | 26/211 [00:16<01:19, 2.33it/s]
13%|█████▎ | 27/211 [00:16<01:12, 2.54it/s]
13%|█████▌ | 28/211 [00:17<01:25, 2.14it/s]
14%|█████▊ | 29/211 [00:17<01:17, 2.35it/s]
14%|█████▉ | 30/211 [00:17<01:19, 2.26it/s]
15%|██████▏ | 31/211 [00:18<01:19, 2.28it/s]
15%|██████▎ | 32/211 [00:18<01:15, 2.38it/s]
16%|██████▌ | 33/211 [00:19<01:18, 2.28it/s]
16%|██████▊ | 34/211 [00:19<01:08, 2.57it/s]
17%|██████▉ | 35/211 [00:19<01:04, 2.72it/s]
17%|███████▏ | 36/211 [00:20<01:03, 2.75it/s]
18%|███████▎ | 37/211 [00:20<01:02, 2.79it/s]
18%|███████▌ | 38/211 [00:21<01:15, 2.29it/s]
18%|███████▊ | 39/211 [00:21<01:12, 2.38it/s]
19%|███████▉ | 40/211 [00:21<01:07, 2.55it/s]
19%|████████▏ | 41/211 [00:22<01:05, 2.60it/s]
20%|████████▎ | 42/211 [00:22<00:59, 2.86it/s]
20%|████████▌ | 43/211 [00:22<01:00, 2.78it/s]
21%|████████▊ | 44/211 [00:23<01:01, 2.72it/s]
21%|████████▉ | 45/211 [00:23<00:53, 3.09it/s]
22%|█████████▏ | 46/211 [00:23<00:54, 3.03it/s]
22%|█████████▎ | 47/211 [00:24<00:57, 2.84it/s]
23%|█████████▌ | 48/211 [00:24<01:02, 2.62it/s]
23%|█████████▊ | 49/211 [00:25<01:04, 2.52it/s]
24%|█████████▉ | 50/211 [00:27<02:25, 1.11it/s]
24%|██████████▏ | 51/211 [00:27<01:58, 1.35it/s]
25%|██████████▎ | 52/211 [00:27<01:46, 1.49it/s]
25%|██████████▌ | 53/211 [00:28<01:24, 1.86it/s]
26%|██████████▋ | 54/211 [00:28<01:20, 1.94it/s]
26%|██████████▉ | 55/211 [00:29<01:28, 1.76it/s]
26%|██████████▉ | 55/211 [00:29<01:25, 1.83it/s]
---------------------------------------------------------------------------
KeyboardInterrupt                         Traceback (most recent call last)
Cell In[4], line 9
      7 ds_meta = {}
      8 for dataset_id in tqdm(df_datasets.index):
----> 9     ds_meta[dataset_id] = utils.get_meta(dataset_id)

File ~/Library/Mobile Documents/com~apple~CloudDocs/Work/teaching/seaocn-teaching/2024.seaocn-uhh/coursebook-seaocn-2024/coursebook_seaocn/seaocn-cb/exercise/erddaputils.py:80, in get_meta(dataset_id, protocol)
     78 e = init_erddap(protocol=protocol)
     79 e.dataset_id = dataset_id
---> 80 meta = e.to_ncCF()
     81 attrs = {}
     82 for key_name in dir(meta):

File ~/micromamba/envs/seaocn_env/lib/python3.8/site-packages/erddapy/erddapy.py:368, in ERDDAP.to_ncCF(self, protocol, **kw)
    366 protocol = protocol if protocol else self.protocol
    367 url = self.get_download_url(response="ncCF", distinct=distinct)
--> 368 return to_ncCF(url, protocol=protocol, requests_kwargs=dict(**kw))

File ~/micromamba/envs/seaocn_env/lib/python3.8/site-packages/erddapy/core/interfaces.py:54, in to_ncCF(url, protocol, requests_kwargs)
     50 if protocol == "griddap":
     51     raise ValueError(
     52         f"Cannot use .ncCF with griddap protocol. The URL you tried to access is: '{url}'.",
     53     )
---> 54 return _nc_dataset(url, requests_kwargs)

File ~/micromamba/envs/seaocn_env/lib/python3.8/site-packages/erddapy/core/netcdf.py:16, in _nc_dataset(url, requests_kwargs)
     13 """Return a netCDF4-python Dataset from memory and fallbacks to disk if that fails."""
     14 from netCDF4 import Dataset
---> 16 data = urlopen(url, requests_kwargs)
     17 try:
     18     return Dataset(Path(urlparse(url).path).name, memory=data.read())

File ~/micromamba/envs/seaocn_env/lib/python3.8/site-packages/erddapy/core/url.py:42, in urlopen(url, requests_kwargs)
     40 if requests_kwargs is None:
     41     requests_kwargs = {}
---> 42 data = _urlopen(url, **requests_kwargs)  # type: ignore
     43 data.seek(0)
     44 return data

File ~/micromamba/envs/seaocn_env/lib/python3.8/site-packages/erddapy/core/url.py:22, in _urlopen(url, auth, **kwargs)
     20 if "timeout" not in kwargs.keys():
     21     kwargs["timeout"] = 60
---> 22 response = httpx.get(url, follow_redirects=True, auth=auth, **kwargs)
     23 try:
     24     response.raise_for_status()

File ~/micromamba/envs/seaocn_env/lib/python3.8/site-packages/httpx/_api.py:198, in get(url, params, headers, cookies, auth, proxy, proxies, follow_redirects, cert, verify, timeout, trust_env)
    175 def get(
    176     url: URLTypes,
    177     *,
   (...)
    188     trust_env: bool = True,
    189 ) -> Response:
    190     """
    191     Sends a `GET` request.
    192
   (...)
    196     on this function, as `GET` requests should not include a request body.
    197     """
--> 198     return request(
    199         "GET",
    200         url,
    201         params=params,
    202         headers=headers,
    203         cookies=cookies,
    204         auth=auth,
    205         proxy=proxy,
    206         proxies=proxies,
    207         follow_redirects=follow_redirects,
    208         cert=cert,
    209         verify=verify,
    210         timeout=timeout,
    211         trust_env=trust_env,
    212     )

File ~/micromamba/envs/seaocn_env/lib/python3.8/site-packages/httpx/_api.py:106, in request(method, url, params, content, data, files, json, headers, cookies, auth, proxy, proxies, timeout, follow_redirects, verify, cert, trust_env)
     46 """
     47 Sends an HTTP request.
     48
   (...)
     95 ```
     96 """
     97 with Client(
     98     cookies=cookies,
     99     proxy=proxy,
   (...)
    104     trust_env=trust_env,
    105 ) as client:
--> 106     return client.request(
    107         method=method,
    108         url=url,
    109         content=content,
    110         data=data,
    111         files=files,
    112         json=json,
    113         params=params,
    114         headers=headers,
    115         auth=auth,
    116         follow_redirects=follow_redirects,
    117     )

File ~/micromamba/envs/seaocn_env/lib/python3.8/site-packages/httpx/_client.py:827, in Client.request(self, method, url, content, data, files, json, params, headers, cookies, auth, follow_redirects, timeout, extensions)
    812     warnings.warn(message, DeprecationWarning)
    814 request = self.build_request(
    815     method=method,
    816     url=url,
   (...)
    825     extensions=extensions,
    826 )
--> 827 return self.send(request, auth=auth, follow_redirects=follow_redirects)

File ~/micromamba/envs/seaocn_env/lib/python3.8/site-packages/httpx/_client.py:928, in Client.send(self, request, stream, auth, follow_redirects)
    926 except BaseException as exc:
    927     response.close()
--> 928     raise exc

File ~/micromamba/envs/seaocn_env/lib/python3.8/site-packages/httpx/_client.py:922, in Client.send(self, request, stream, auth, follow_redirects)
    920 try:
    921     if not stream:
--> 922         response.read()
    924     return response
    926 except BaseException as exc:

File ~/micromamba/envs/seaocn_env/lib/python3.8/site-packages/httpx/_models.py:813, in Response.read(self)
    809 """
    810 Read and return the response content.
    811 """
    812 if not hasattr(self, "_content"):
--> 813     self._content = b"".join(self.iter_bytes())
    814 return self._content

File ~/micromamba/envs/seaocn_env/lib/python3.8/site-packages/httpx/_models.py:829, in Response.iter_bytes(self, chunk_size)
    827 chunker = ByteChunker(chunk_size=chunk_size)
    828 with request_context(request=self._request):
--> 829     for raw_bytes in self.iter_raw():
    830         decoded = decoder.decode(raw_bytes)
    831         for chunk in chunker.decode(decoded):

File ~/micromamba/envs/seaocn_env/lib/python3.8/site-packages/httpx/_models.py:883, in Response.iter_raw(self, chunk_size)
    880 chunker = ByteChunker(chunk_size=chunk_size)
    882 with request_context(request=self._request):
--> 883     for raw_stream_bytes in self.stream:
    884         self._num_bytes_downloaded += len(raw_stream_bytes)
    885         for chunk in chunker.decode(raw_stream_bytes):

File ~/micromamba/envs/seaocn_env/lib/python3.8/site-packages/httpx/_client.py:126, in BoundSyncStream.__iter__(self)
    125 def __iter__(self) -> typing.Iterator[bytes]:
--> 126     for chunk in self._stream:
    127         yield chunk

File ~/micromamba/envs/seaocn_env/lib/python3.8/site-packages/httpx/_transports/default.py:113, in ResponseStream.__iter__(self)
    111 def __iter__(self) -> typing.Iterator[bytes]:
    112     with map_httpcore_exceptions():
--> 113         for part in self._httpcore_stream:
    114             yield part

File ~/micromamba/envs/seaocn_env/lib/python3.8/site-packages/httpcore/_sync/connection_pool.py:367, in PoolByteStream.__iter__(self)
    365 except BaseException as exc:
    366     self.close()
--> 367     raise exc from None

File ~/micromamba/envs/seaocn_env/lib/python3.8/site-packages/httpcore/_sync/connection_pool.py:363, in PoolByteStream.__iter__(self)
    361 def __iter__(self) -> Iterator[bytes]:
    362     try:
--> 363         for part in self._stream:
    364             yield part
    365     except BaseException as exc:

File ~/micromamba/envs/seaocn_env/lib/python3.8/site-packages/httpcore/_sync/http11.py:349, in HTTP11ConnectionByteStream.__iter__(self)
    347 with ShieldCancellation():
    348     self.close()
--> 349 raise exc

File ~/micromamba/envs/seaocn_env/lib/python3.8/site-packages/httpcore/_sync/http11.py:341, in HTTP11ConnectionByteStream.__iter__(self)
    339 try:
    340     with Trace("receive_response_body", logger, self._request, kwargs):
--> 341         for chunk in self._connection._receive_response_body(**kwargs):
    342             yield chunk
    343 except BaseException as exc:
    344     # If we get an exception while streaming the response,
    345     # we want to close the response (and possibly the connection)
    346     # before raising that exception.

File ~/micromamba/envs/seaocn_env/lib/python3.8/site-packages/httpcore/_sync/http11.py:210, in HTTP11Connection._receive_response_body(self, request)
    207 timeout = timeouts.get("read", None)
    209 while True:
--> 210     event = self._receive_event(timeout=timeout)
    211     if isinstance(event, h11.Data):
    212         yield bytes(event.data)

File ~/micromamba/envs/seaocn_env/lib/python3.8/site-packages/httpcore/_sync/http11.py:224, in HTTP11Connection._receive_event(self, timeout)
    221     event = self._h11_state.next_event()
    223 if event is h11.NEED_DATA:
--> 224     data = self._network_stream.read(
    225         self.READ_NUM_BYTES, timeout=timeout
    226     )
    228     # If we feed this case through h11 we'll raise an exception like:
    229     #
    230     #     httpcore.RemoteProtocolError: can't handle event type
   (...)
    234     # perspective. Instead we handle this case distinctly and treat
    235     # it as a ConnectError.
    236     if data == b"" and self._h11_state.their_state == h11.SEND_RESPONSE:

File ~/micromamba/envs/seaocn_env/lib/python3.8/site-packages/httpcore/_backends/sync.py:126, in SyncStream.read(self, max_bytes, timeout)
    124 with map_exceptions(exc_map):
    125     self._sock.settimeout(timeout)
--> 126     return self._sock.recv(max_bytes)

File ~/micromamba/envs/seaocn_env/lib/python3.8/ssl.py:1259, in SSLSocket.recv(self, buflen, flags)
   1255     if flags != 0:
   1256         raise ValueError(
   1257             "non-zero flags not allowed in calls to recv() on %s" %
   1258             self.__class__)
-> 1259     return self.read(buflen)
   1260 else:
   1261     return super().recv(buflen, flags)

File ~/micromamba/envs/seaocn_env/lib/python3.8/ssl.py:1134, in SSLSocket.read(self, len, buffer)
   1132         return self._sslobj.read(len, buffer)
   1133     else:
-> 1134         return self._sslobj.read(len)
   1135 except SSLError as x:
   1136     if x.args[0] == SSL_ERROR_EOF and self.suppress_ragged_eofs:

KeyboardInterrupt:
See also
You can find out where VOTO data are available and since when on their “stats” page: https://observations.voiceoftheocean.org/stats
We just downloaded information on all the datasets (but not the data!) so that now we can just find the specific datasets we want based on specific criteria.
3. Download glider data#
a. Åland sea data#
Åland Sea or the Sea of Åland is between Sweden and Finland. It’s a narrow strait with stratification and currents.
# Create a list of the datasets available in this region
name=[]
for dataset_id, meta in ds_meta.items():
    if meta['deployment_start']>'2023-02-01':
        if 'Åland' in meta['basin']:
            name.append(dataset_id)
print(f'Found {len(name)} datasets in Åland: {name}')
Found 6 datasets in Åland: ['nrt_SEA076_M21', 'nrt_SEA076_M24', 'nrt_SEA066_M56', 'nrt_SEA077_M29', 'nrt_SEA056_M68', 'nrt_SEA078_M24']
Near-real time vs delayed-mode data
In this exercise, we will only use near-real time (NRT) data and not delayed mode as it would be way slower otherwise.
NRT data from the VOTO gliders generally contain only one file every 3-4 hours (last dive of 2-12 multi-dives). The CTD data are additionally subsampled to datapoints every 30 seconds (instead of the nominal time interval of 1 second).
In deep areas such as the Åland sea, this means that in the NRT files we have approximately every other dive with 30s data. In shallower locations (e.g., the Bornholm basin), we may get one data file every 6-8 dives at 30 second time-resolution.
In areas with a more complex bathymetry as the Kattegat/Skagerrak area where the glider dives as deep as 200m in the north and as shallow as 40m in the south, we then receive files every 2 to 12 dives for the NRT dataset.
# Download the glider dataset using the optional argument `nrt_only=True`
ds_nrt = utils.download_glider_dataset(name, nrt_only=True)
0%| | 0/6 [00:00<?, ?it/s]
Downloading nrt_SEA076_M21
17%|███████▊ | 1/6 [00:01<00:08, 1.65s/it]
Downloading nrt_SEA076_M24
33%|███████████████▋ | 2/6 [00:04<00:08, 2.25s/it]
Downloading nrt_SEA066_M56
50%|███████████████████████▌ | 3/6 [00:06<00:06, 2.02s/it]
Downloading nrt_SEA077_M29
67%|███████████████████████████████▎ | 4/6 [00:07<00:03, 1.82s/it]
Downloading nrt_SEA056_M68
83%|███████████████████████████████████████▏ | 5/6 [00:09<00:01, 1.68s/it]
Downloading nrt_SEA078_M24
100%|███████████████████████████████████████████████| 6/6 [00:10<00:00, 1.82s/it]
Inspect the data#
To start with, let’s take a look at our data. We can do this by simply printing to the screen once we know which dataset we’re looking for.
Compare the two commands, to see what different information/display formats you get:
ds_nrt['nrt_SEA076_M21']
and then separately,
print(ds_nrt['nrt_SEA076_M21']
Take a look at the metadata and structure of the data.
What type are the data?
What is the “dimension”, and how long is it?
What is the variable name for temperature? for salinity? for depth?
Do you get different information if you do the following commands?
ds_nrt['nrt_SEA076_M21'].keys()
list(ds_nrt['nrt_SEA076_M21'].coords)
list(ds_nrt['nrt_SEA076_M21'].data_vars)
print(ds_nrt['nrt_SEA076_M21'].dims)
#list(ds_nrt['nrt_SEA078_M24'].data_vars)
Concatenate datasets#
From above, we see that there were five missions of gliders to the Åland Sea. Rather than dealing with them separately, let’s put them all together in a single xarray DataArray. We are going to use datasets 0 and 1 only:
choose_name = ['nrt_SEA076_M21', 'nrt_SEA076_M24']
choose_name = ['nrt_SEA076_M21', 'nrt_SEA076_M24']

for i in range(len(choose_name)):
    print(choose_name[i])
nrt_SEA076_M21
nrt_SEA076_M24
# Initialise a dataset as empty
full_data = []

# Cycle through each of the glider datasets listed in `name`
for i in range(len(name)):
    # For each dataset, append it to the data in full_data (starts empty, and grows)
    full_data.append(ds_nrt[name[i]].drop_vars(["backscatter_raw","backscatter_scaled","particulate_backscatter",
                                                "phycocyanin","phycocyanin_raw","cdom","cdom_qc","cdom_raw","cdom_raw_qc"],
                                               errors="ignore"))

# Concatenate datasets together along the time dimension
full_data = xr.concat(full_data, dim= 'time')
print(full_data)
<xarray.Dataset>
Dimensions:                        (time: 294581)
Coordinates:
    latitude                       (time) float64 60.01 60.01 ... 60.0 60.0
    longitude                      (time) float64 19.69 19.69 ... 19.69 19.69
  * time                           (time) datetime64[ns] 2023-11-17T12:25:02....
    depth                          (time) float64 0.08757 0.08608 ... 1.63 2.217
Data variables: (12/52)
    ad2cp_beam1_cell_number1       (time) float32 nan nan nan ... 0.25 0.05
    ad2cp_beam2_cell_number1       (time) float32 nan nan nan ... 0.05 -0.01
    ad2cp_beam3_cell_number1       (time) float32 nan nan nan ... -0.16 -0.02
    ad2cp_beam4_cell_number1       (time) float32 nan nan nan ... 0.01 0.06 0.0
    ad2cp_heading                  (time) float32 nan nan nan ... 305.4 300.0
    ad2cp_pitch                    (time) float32 nan nan nan ... -75.7 -74.2
    ...                             ...
    security_level                 (time) float32 0.0 0.0 0.0 ... 0.0 0.0 0.0
    temperature                    (time) float32 1.635 1.654 ... 2.655 nan
    temperature_oxygen             (time) float32 3.375 3.483 ... 2.521 2.487
    temperature_qc                 (time) float32 1.0 1.0 1.0 ... 1.0 1.0 1.0
    vertical_distance_to_seafloor  (time) float32 nan nan nan ... nan nan nan
    voltage                        (time) float32 29.2 29.2 29.2 ... 24.1 24.1
Attributes: (12/76)
    acknowledgement:               This study used data collected and made fr...
    AD2CP:                         {'calibration_date': '2023-08-16', 'factor...
    basin:                         Åland Sea
    cdm_data_type:                 TimeSeries
    cdm_timeseries_variables:      profile_index
    comment:                       deployment and recovery in Gotland
    ...                            ...
    title:                         Fibbla76-20231117T1225
    total_dives:                   207.0
    transmission_system:           IRIDIUM
    variables:                     time\nlatitude\nlongitude\nnav_state\nhead...
    Westernmost_Easting:           19.290116666666666
    wmo_id:                        6801665
b. Baltic inflow#
What are Baltic Inflows?
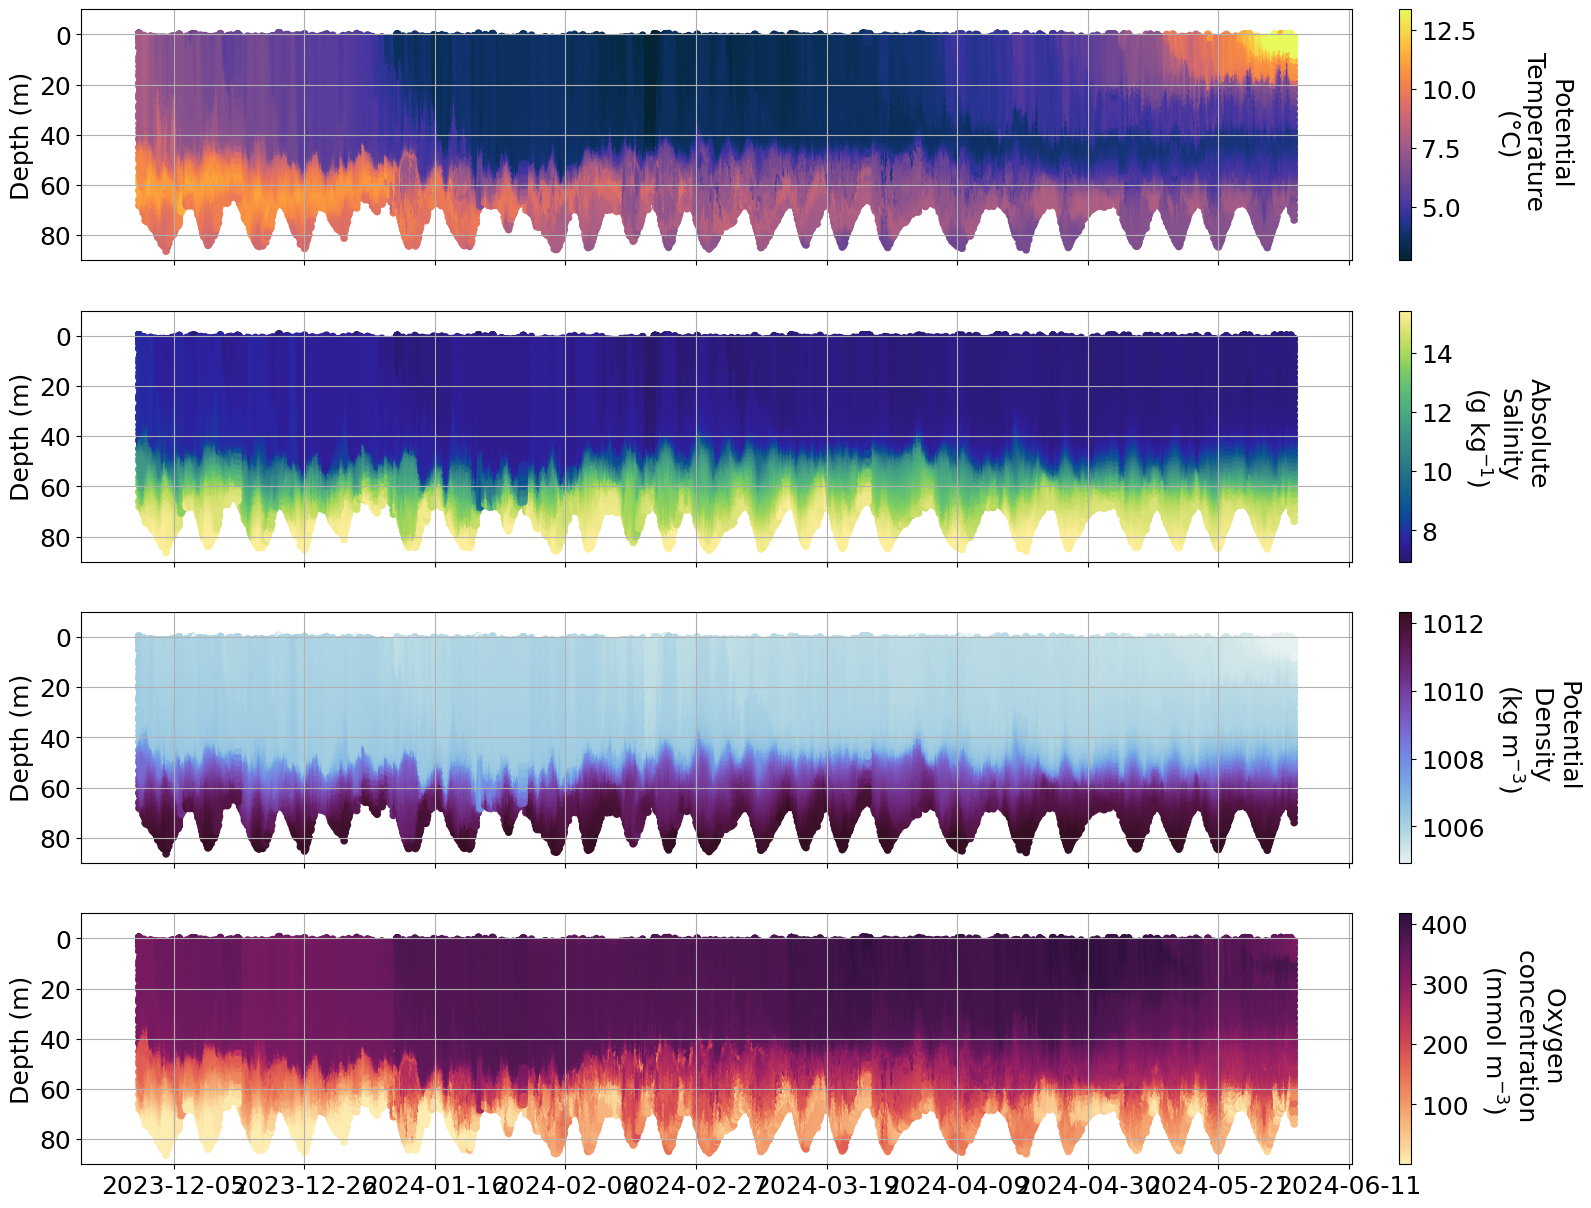
The deep water in the Baltic Proper is renewed during specific conditions: when salt water from the Kattegat flows through the Belt and the Sound, and fills in turn the deep areas of the Arkona Basin, the Bornholm Basin, the Eastern Gotland Basin and the western Gotland Basin. They manifest as bottom gravity currents.
The Baltic Sea is a very enclosed sea characterized by brakish waters, and salt water only enters through the narrow Danish straits. Water masses change in the upper layers and interlayer, but not near the bottom. The deep waters of the Baltic sea are anoxic. When large amounts of salty water from the North Sea enters the Baltic, this salty and dense oxygen-rich water can replace the anoxic deep water. Such events are called Major Baltic Inflows (MBI) which are a necessary phenomena as they allow oxygen to be replenished in the deepest parts of the Baltic.
Detecting Baltic inflows with observations can be a challenge. The short duration of the inflows (2–3 weeks) poses a challenge to traditional field measurements. As a consequence, the BIs are prone to undersampling and difficult to predict. Since regular monitoring cruises in the Baltic Sea typically occur monthly or less frequently, the likelihood of missing or only partially resolving a BI is high.
In December, a Baltic inflow was detected. This recent inflow brought 80 km\(^3\) of new salty water into the Baltic Sea, making this event a medium size inflow. The last comparable one was over 5 years ago. The inflow corresponds to 1.6 Gt (1.6 billion t) of salt. This is the first event of this scale since the VOTO observatories started.
Estimated that by the beginning of February, the deep water in Bornholm Basin will be exchanged by the new salty inflow.
# We want to find data from the Bornholm Basin (the first basin after the Danish straits) from early December 2023 until now

name=[]
for dataset_id, meta in ds_meta.items():
    if meta['deployment_end']>'2023-12-01':
        if 'Bornholm' in meta['basin']:
            name.append(dataset_id)
print(f'Found {len(name)} datasets in Bornholm: {name}')
Found 10 datasets in Bornholm: ['nrt_SEA068_M30', 'nrt_SEA063_M69', 'nrt_SEA063_M71', 'nrt_SEA063_M72', 'nrt_SEA063_M73', 'nrt_SEA067_M51', 'nrt_SEA067_M53', 'nrt_SEA067_M55', 'nrt_SEA067_M56', 'nrt_SEA067_M58']
ds_nrt = utils.download_glider_dataset(name, nrt_only=True)
0%| | 0/10 [00:00<?, ?it/s]
Downloading nrt_SEA068_M30
10%|████▌ | 1/10 [00:00<00:05, 1.80it/s]
Downloading nrt_SEA063_M69
20%|█████████▏ | 2/10 [00:01<00:04, 1.77it/s]
Downloading nrt_SEA063_M71
30%|█████████████▊ | 3/10 [00:01<00:03, 1.84it/s]
Downloading nrt_SEA063_M72
40%|██████████████████▍ | 4/10 [00:02<00:03, 1.95it/s]
Downloading nrt_SEA063_M73
50%|███████████████████████ | 5/10 [00:02<00:02, 1.87it/s]
Downloading nrt_SEA067_M51
60%|███████████████████████████▌ | 6/10 [00:03<00:02, 1.92it/s]
Downloading nrt_SEA067_M53
70%|████████████████████████████████▏ | 7/10 [00:03<00:01, 1.91it/s]
Downloading nrt_SEA067_M55
80%|████████████████████████████████████▊ | 8/10 [00:04<00:01, 1.98it/s]
Downloading nrt_SEA067_M56
90%|█████████████████████████████████████████▍ | 9/10 [00:04<00:00, 1.95it/s]
Downloading nrt_SEA067_M58
100%|█████████████████████████████████████████████| 10/10 [00:05<00:00, 1.96it/s]
full_data = []

for i in range(len(name)):
    # Remove offending variables while appending by using `drop_vars`
    full_data.append(ds_nrt[name[i]].drop_vars(["backscatter_raw","backscatter_scaled","particulate_backscatter",
                                                "phycocyanin","phycocyanin_raw","cdom","cdom_qc","cdom_raw","cdom_raw_qc"],
                                                      errors="ignore"))
full_data = xr.concat(full_data, dim= 'time')

fig, ax = plt.subplots(4,1,figsize=(20, 15), sharex=True)
matplotlib.rcParams.update({'font.size': 18})
time=mdates.date2num(full_data.time)
t=ax[0].scatter( time,full_data.depth, c=full_data.temperature,s=20, cmap=cmo.thermal, vmin=np.nanpercentile(full_data.temperature, 0.5), vmax=np.nanpercentile(full_data.temperature, 99.5))
s=ax[1].scatter( time,full_data.depth, c=full_data.salinity,s=20,cmap=cmo.haline, vmin=np.nanpercentile(full_data.salinity, 0.5), vmax=np.nanpercentile(full_data.salinity, 99.5))
d=ax[2].scatter( time,full_data.depth, c=full_data.density, s=20, cmap=cmo.dense, vmin=np.nanpercentile(full_data.density, 0.5), vmax=np.nanpercentile(full_data.density, 99.5))
o=ax[3].scatter( time,full_data.depth, c=full_data.oxygen_concentration,cmap=cmo.matter, s=20,vmin=np.nanpercentile(full_data.oxygen_concentration, 0.5), vmax=np.nanpercentile(full_data.oxygen_concentration, 99.5))

[a.set_ylim(90,-10) for a in ax]
[a.grid() for a in ax]
ax[1].xaxis.reset_ticks()
ax[1].xaxis.set_major_locator(mdates.WeekdayLocator(byweekday = 1, interval=3))
ax[1].xaxis.set_major_formatter(mdates.DateFormatter('%Y-%m-%d'))


cbarT=plt.colorbar(t, ax=ax[0], pad = 0.03)
cbarT.set_label('Potential \nTemperature \n(°C)',labelpad=70, y=0.5, rotation=270,fontsize=18)
cbarS=plt.colorbar(s, ax=ax[1], pad = 0.03)
cbarS.set_label('Absolute \nSalinity \n(g kg$^{-1}$)',labelpad=70, y=0.5, rotation=270,fontsize=18)
cbarD=plt.colorbar(d, ax=ax[2], pad = 0.03)
cbarD.set_label('Potential \nDensity \n(kg m$^{-3}$)',labelpad=70, y=0.5, rotation=270,fontsize=18)
cbarO=plt.colorbar(o, ax=ax[3], pad = 0.03)
cbarO.set_label('Oxygen \nconcentration \n(mmol m$^{-3}$)',labelpad=70, y=0.5, rotation=270,fontsize=18)

[a.tick_params(axis='both', which='major', labelsize=18) for a in ax]
[a.set_ylabel('Depth (m)',fontsize=18) for a in ax]
[Text(0, 0.5, 'Depth (m)'),
 Text(0, 0.5, 'Depth (m)'),
 Text(0, 0.5, 'Depth (m)'),
 Text(0, 0.5, 'Depth (m)')]
Info
There are issues with some of the oxygen data and more info can be found here https://observations.voiceoftheocean.org/static/img/reports/Quality_Issue_1_AROD.pdf
c. Hans storm#
https://www.krisinformation.se/en/hazards-and-risks/disasters-and-incidents/2023/storm-hans
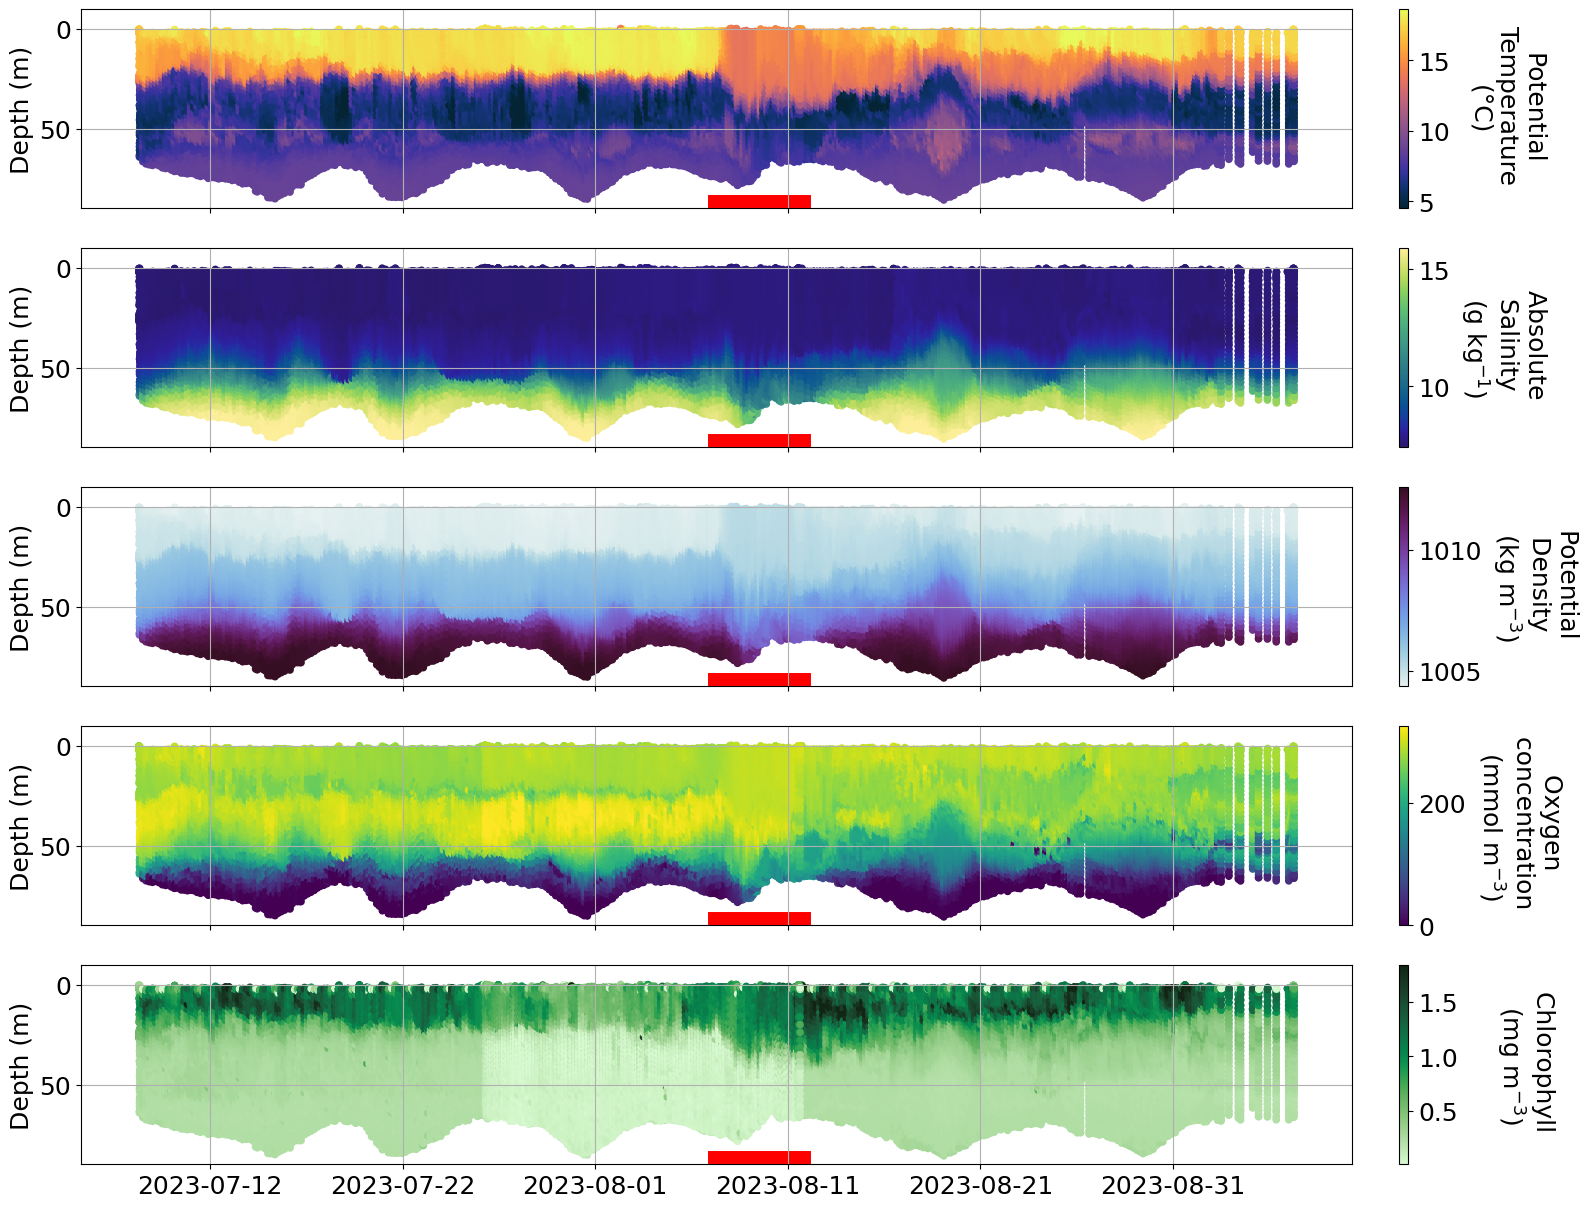
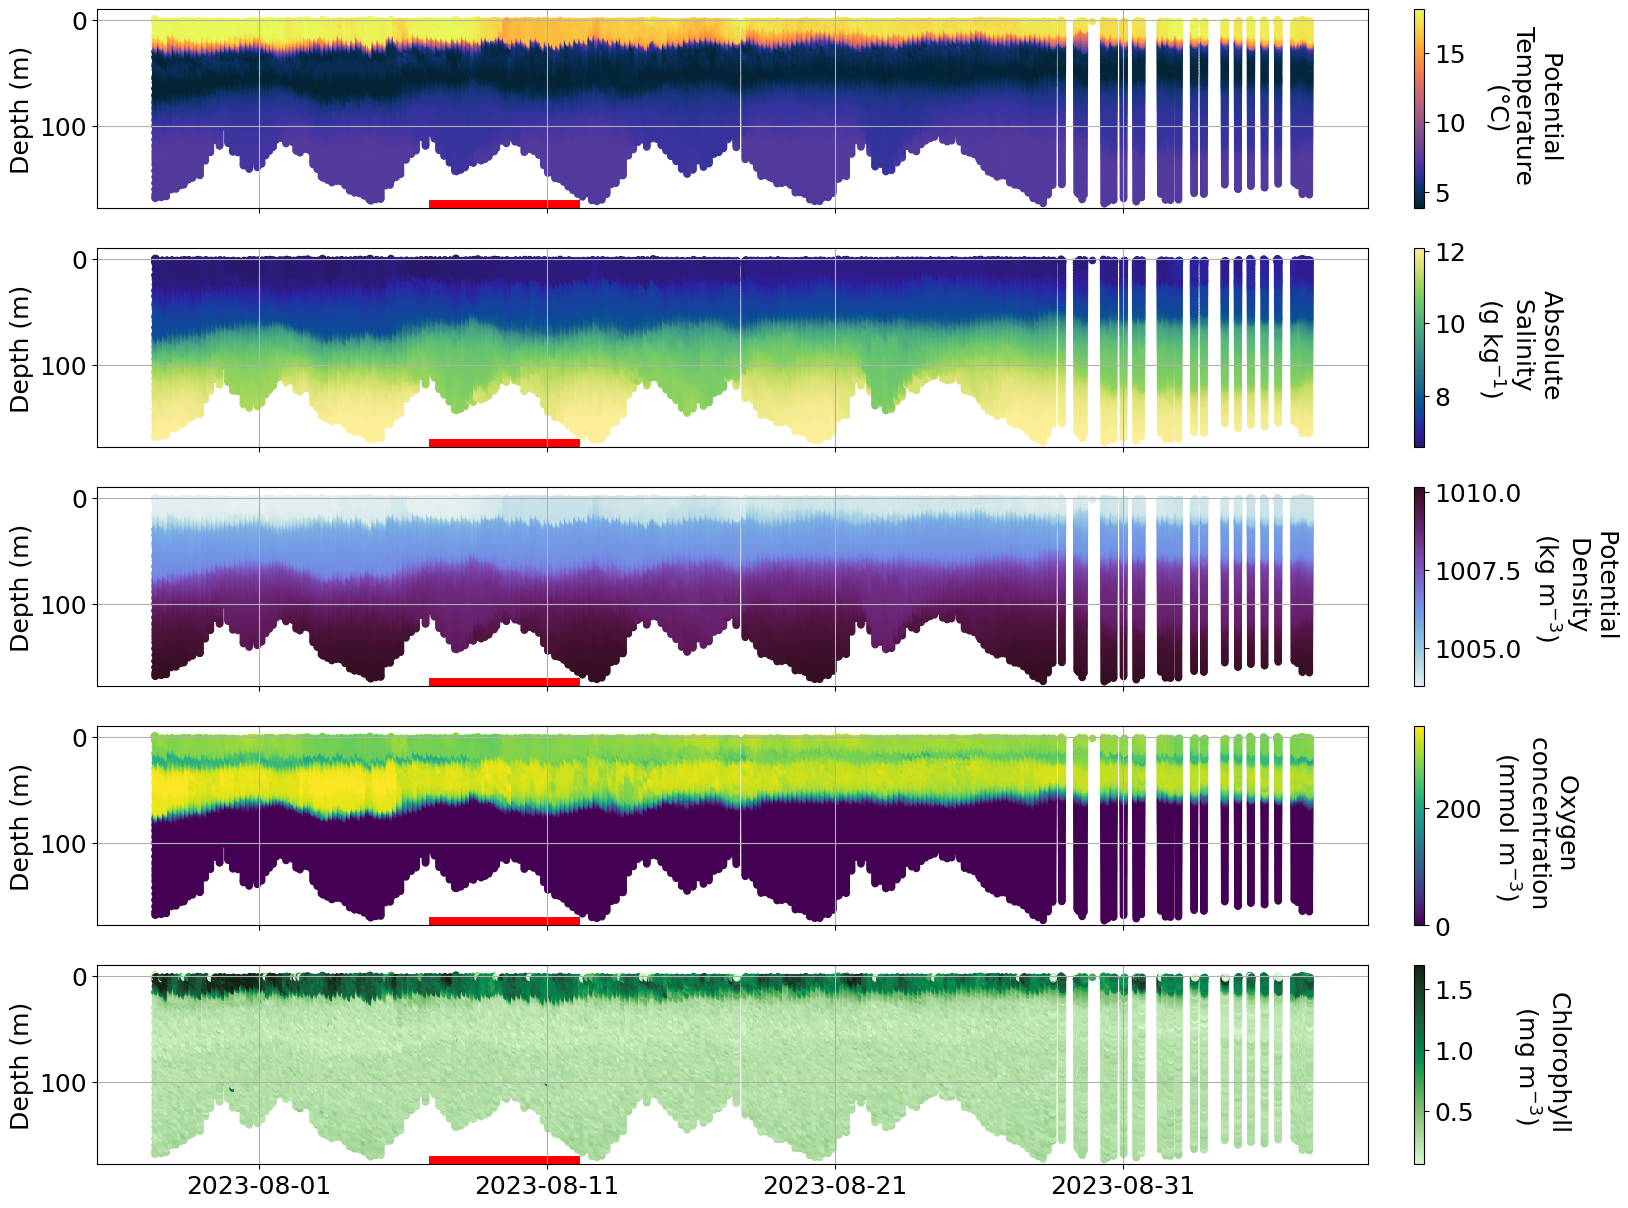
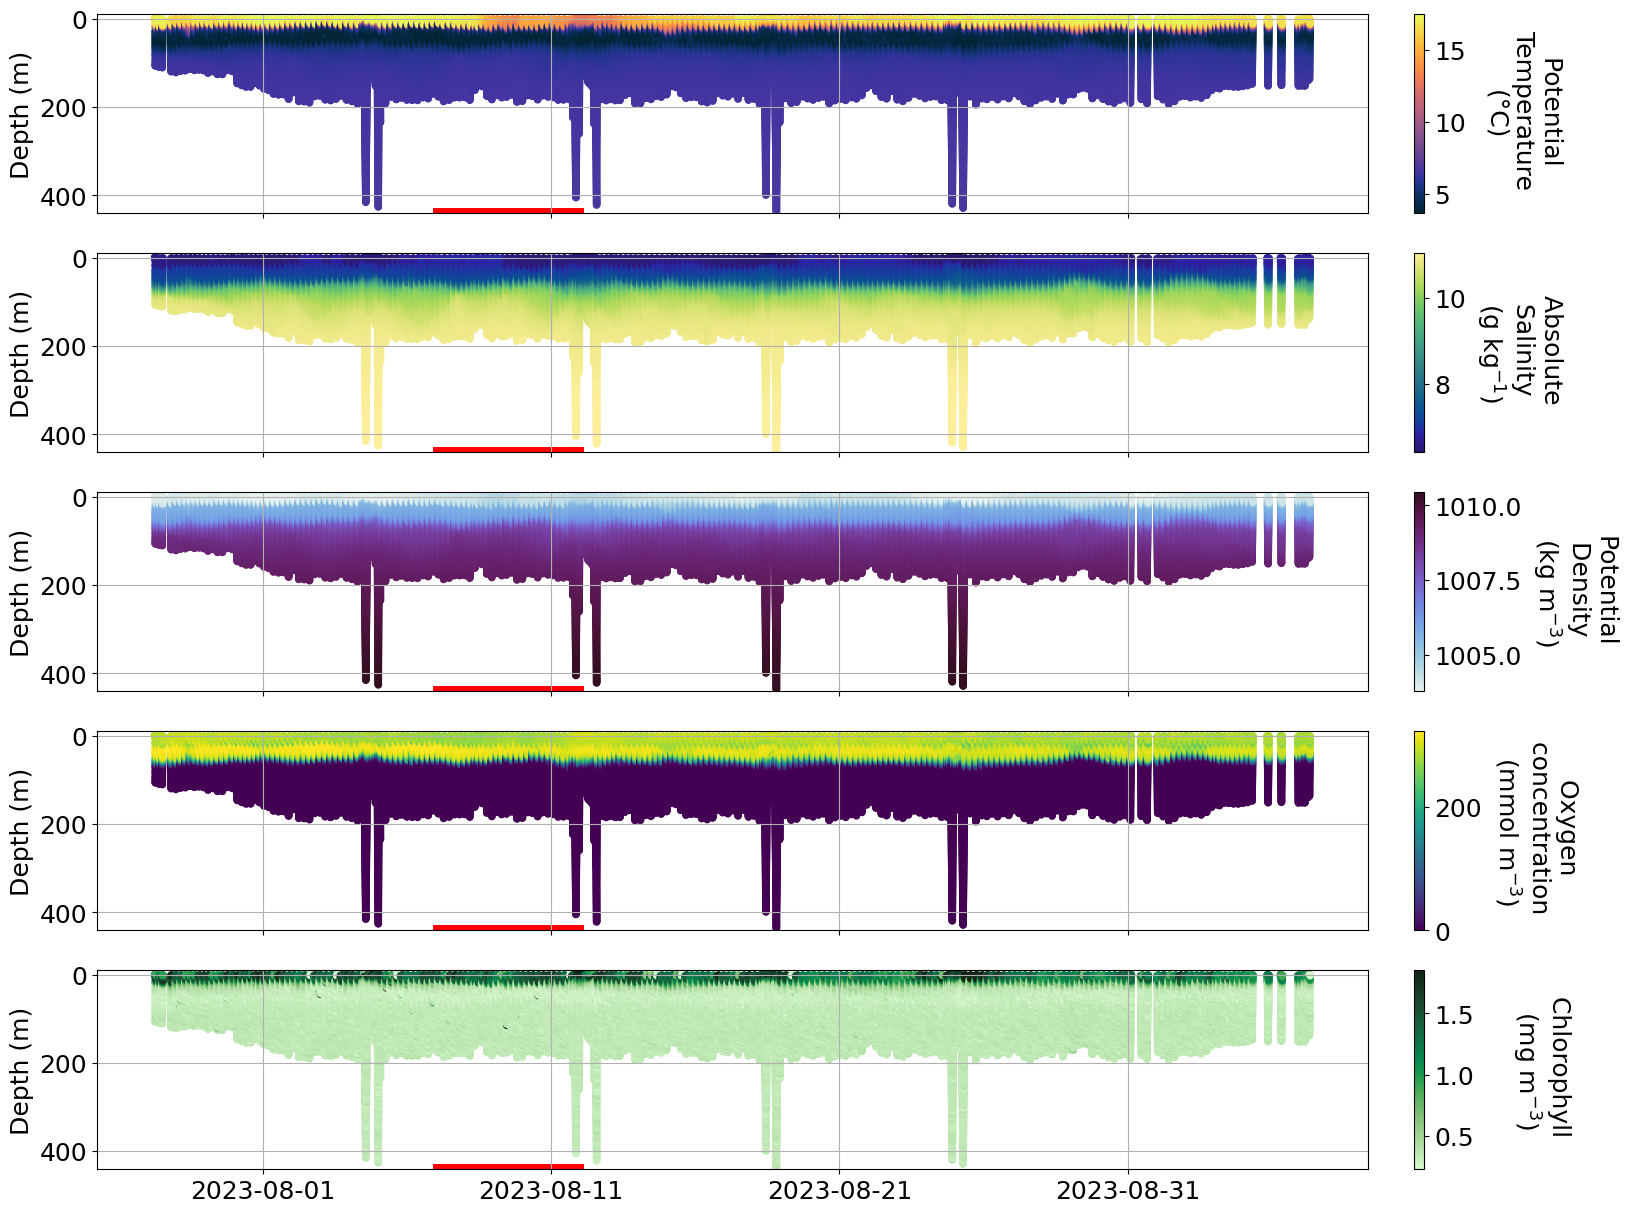
During the first week on August 2023 a strong storm hit Sweden and Norway causing big floodings and high water level in multiple areas.
Is it possible to see the effect of the storm on any of the glider data?
## We look for all the glider data avaialble from early July to end of August
name=[]
for dataset_id, meta in ds_meta.items():
    if meta['deployment_start']>'2023-07-01':
        if meta['deployment_start']<'2023-09-01':
            name.append(dataset_id)
print(f'Found {len(name)} datasets between July 1st 2023 and September 1st 2023: {name}')
Found 9 datasets between July 1st 2023 and September 1st 2023: ['nrt_SEA069_M15', 'nrt_SEA063_M62', 'nrt_SEA063_M63', 'nrt_SEA044_M83', 'nrt_SEA044_M84', 'nrt_SEA044_M85', 'nrt_SEA067_M46', 'nrt_SEA077_M24', 'nrt_SEA078_M14']
ds_nrt = utils.download_glider_dataset(name, nrt_only=True)
0%| | 0/9 [00:00<?, ?it/s]
Downloading nrt_SEA069_M15
11%|█████▏ | 1/9 [00:00<00:03, 2.28it/s]
Downloading nrt_SEA063_M62
22%|██████████▍ | 2/9 [00:00<00:03, 2.11it/s]
Downloading nrt_SEA063_M63
33%|███████████████▋ | 3/9 [00:01<00:03, 1.95it/s]
Downloading nrt_SEA044_M83
44%|████████████████████▉ | 4/9 [00:02<00:02, 1.92it/s]
Downloading nrt_SEA044_M84
56%|██████████████████████████ | 5/9 [00:02<00:02, 1.87it/s]
Downloading nrt_SEA044_M85
67%|███████████████████████████████▎ | 6/9 [00:03<00:01, 1.77it/s]
Downloading nrt_SEA067_M46
78%|████████████████████████████████████▌ | 7/9 [00:03<00:01, 1.81it/s]
Downloading nrt_SEA077_M24
89%|█████████████████████████████████████████▊ | 8/9 [00:05<00:00, 1.23it/s]
Downloading nrt_SEA078_M14
100%|███████████████████████████████████████████████| 9/9 [00:06<00:00, 1.40it/s]
## We want to see where the data  is from and get a bit more info summarized
table=pd.DataFrame(columns = ['Glider','Location','Mission','Start_Date'])
missions=name
dic=ds_nrt
table.Mission= range(0,len(missions))

for i in range(len(missions)):
    d=dic[missions[i]]
    table.loc[i, 'Glider']=f'SEA0{int(d.attrs["glider_serial"])}'
    table.loc[i,'Mission']=int(d.attrs["deployment_id"])
    table.loc[i, 'Start_Date']=d.attrs["deployment_start"][:10]
    table.loc[i,'Location']=d.attrs["basin"]


table.sort_values(by=["Start_Date"], ascending=True)
| Glider | Location | Mission | Start_Date | |
|---|---|---|---|---|
| 1 | SEA063 | Bornholm Basin | 62 | 2023-07-08 |
| 3 | SEA044 | Skagerrak, Kattegat | 83 | 2023-07-10 |
| 0 | SEA069 | Bornholm Basin | 15 | 2023-07-26 |
| 6 | SEA067 | Bornholm Basin | 46 | 2023-07-26 |
| 7 | SEA077 | Eastern Gotland Basin, Northern Baltic Proper | 24 | 2023-07-28 |
| 8 | SEA078 | Western Gotland Basin | 14 | 2023-07-28 |
| 4 | SEA044 | Skagerrak, Kattegat | 84 | 2023-08-04 |
| 2 | SEA063 | Bornholm Basin | 63 | 2023-08-11 |
| 5 | SEA044 | Skagerrak, Kattegat | 85 | 2023-08-23 |
print(f'We have data from {len(table.Location.unique())} different sites during this period: {table.Location.unique()}')
We have data from 4 different sites during this period: ['Bornholm Basin' 'Skagerrak, Kattegat'
 'Eastern Gotland Basin, Northern Baltic Proper' 'Western Gotland Basin']
# We can try to plot data and see if anything is visible in any of the 4 areas
def plot_sel_data(basin='Bornholm', date_start='2023-07-01', date_end='2023-09-01', rectangle=True,  delayed = False):

    name=[]
    for dataset_id, meta in ds_meta.items():
        if meta['deployment_start']>date_start:
            if meta['deployment_start']<date_end:
                if basin in meta['basin']:
                    if 'SAMBA' in meta['project']:
                        if delayed == True:
                            name.append(f'delayed{dataset_id[3:]}')
                        else:
                            name.append(dataset_id)


    ds_nrt = utils.download_glider_dataset(name, nrt_only=False)

    full_data = []
    for i in range(len(name)):
        full_data.append(ds_nrt[name[i]].drop_vars(["backscatter_raw","backscatter_scaled","particulate_backscatter",
                                                    "phycocyanin","phycocyanin_raw","cdom","cdom_qc","cdom_raw","cdom_raw_qc",
                                                   "backscatter_raw_secondary","backscatter_scaled_secondary","chlorophyll_raw_secondary",
                                                   "chlorophyll_secondary","nanoflu_temperature","phycocyanin_nanoflu"],
                                                    errors="ignore"))
    full_data = xr.concat(full_data, dim= 'time')

    fig, ax = plt.subplots(5,1,figsize=(20, 15), sharex=True)

    time=mdates.date2num(full_data.time)
    t=ax[0].scatter( time,full_data.depth, c=full_data.temperature,s=20, cmap=cmo.thermal, vmin=np.nanpercentile(full_data.temperature, 0.5), vmax=np.nanpercentile(full_data.temperature, 99.5))
    s=ax[1].scatter( time,full_data.depth, c=full_data.salinity,s=20,cmap=cmo.haline, vmin=np.nanpercentile(full_data.salinity, 0.5), vmax=np.nanpercentile(full_data.salinity, 99.5))
    d=ax[2].scatter( time,full_data.depth, c=full_data.density, s=20, cmap=cmo.dense, vmin=np.nanpercentile(full_data.density, 0.5), vmax=np.nanpercentile(full_data.density, 99.5))
    o=ax[3].scatter( time,full_data.depth, c=full_data.oxygen_concentration, s=20,vmin=np.nanpercentile(full_data.oxygen_concentration, 0.5), vmax=np.nanpercentile(full_data.oxygen_concentration, 99.5))
    c=ax[4].scatter( time,full_data.depth, c=full_data.chlorophyll, s=20, cmap=cmo.algae, vmin=np.nanpercentile(full_data.chlorophyll, 0.5), vmax=np.nanpercentile(full_data.chlorophyll, 99.5))

    # Highlight storm period
    if rectangle:
        for a in ax:
            rect = patches.Rectangle((int(mdates.date2num(['2023-08-07'])[0]), int(full_data.depth.max())), 5, 3, linewidth=5, edgecolor='r', facecolor='red', fill='red')
            a.add_patch(rect)

    [a.set_ylim(int(full_data.depth.max())+5,-10) for a in ax]
    [a.grid() for a in ax]

    ax[4].xaxis.set_major_formatter(mdates.DateFormatter('%Y-%m-%d'))
    ax[4].locator_params(axis='x', nbins=8)

    cbarT=plt.colorbar(t, ax=ax[0], pad = 0.03)
    cbarT.set_label('Potential \nTemperature \n(°C)',labelpad=70, y=0.5, rotation=270,fontsize=18)
    cbarS=plt.colorbar(s, ax=ax[1], pad = 0.03)
    cbarS.set_label('Absolute \nSalinity \n(g kg$^{-1}$)',labelpad=70, y=0.5, rotation=270,fontsize=18)
    cbarD=plt.colorbar(d, ax=ax[2], pad = 0.03)
    cbarD.set_label('Potential \nDensity \n(kg m$^{-3}$)',labelpad=70, y=0.5, rotation=270,fontsize=18)
    cbarO=plt.colorbar(o, ax=ax[3], pad = 0.03)
    cbarO.set_label('Oxygen \nconcentration \n(mmol m$^{-3}$)',labelpad=70, y=0.5, rotation=270,fontsize=18)
    cbarC=plt.colorbar(c, ax=ax[4], pad = 0.03)
    cbarC.set_label('Chlorophyll \n(mg m$^{-3}$)',labelpad=70, y=0.5, rotation=270,fontsize=18)

    [a.tick_params(axis='both', which='major', labelsize=18) for a in ax]
    [a.set_ylabel('Depth (m)',fontsize=18) for a in ax]
plot_sel_data(basin='Bornholm',date_start='2023-07-01', date_end='2023-09-01',)
100%|███████████████████████████████████████████████| 4/4 [00:00<00:00, 61.89it/s]
Downloading nrt_SEA069_M15
Downloading nrt_SEA063_M62
Downloading nrt_SEA063_M63
Downloading nrt_SEA067_M46
plot_sel_data(basin='Eastern Gotland',date_start='2023-07-01', date_end='2023-09-01')
100%|███████████████████████████████████████████████| 1/1 [00:00<00:00, 49.52it/s]
Downloading nrt_SEA077_M24
plot_sel_data(basin='Western Gotland',date_start='2023-07-01', date_end='2023-09-01')
100%|███████████████████████████████████████████████| 1/1 [00:00<00:00, 50.54it/s]
Downloading nrt_SEA078_M14
plot_sel_data(basin='Kattegat', date_start='2023-07-01', date_end='2023-09-01')
100%|███████████████████████████████████████████████| 3/3 [00:00<00:00, 72.57it/s]
Downloading nrt_SEA044_M83
Downloading nrt_SEA044_M84
Downloading nrt_SEA044_M85
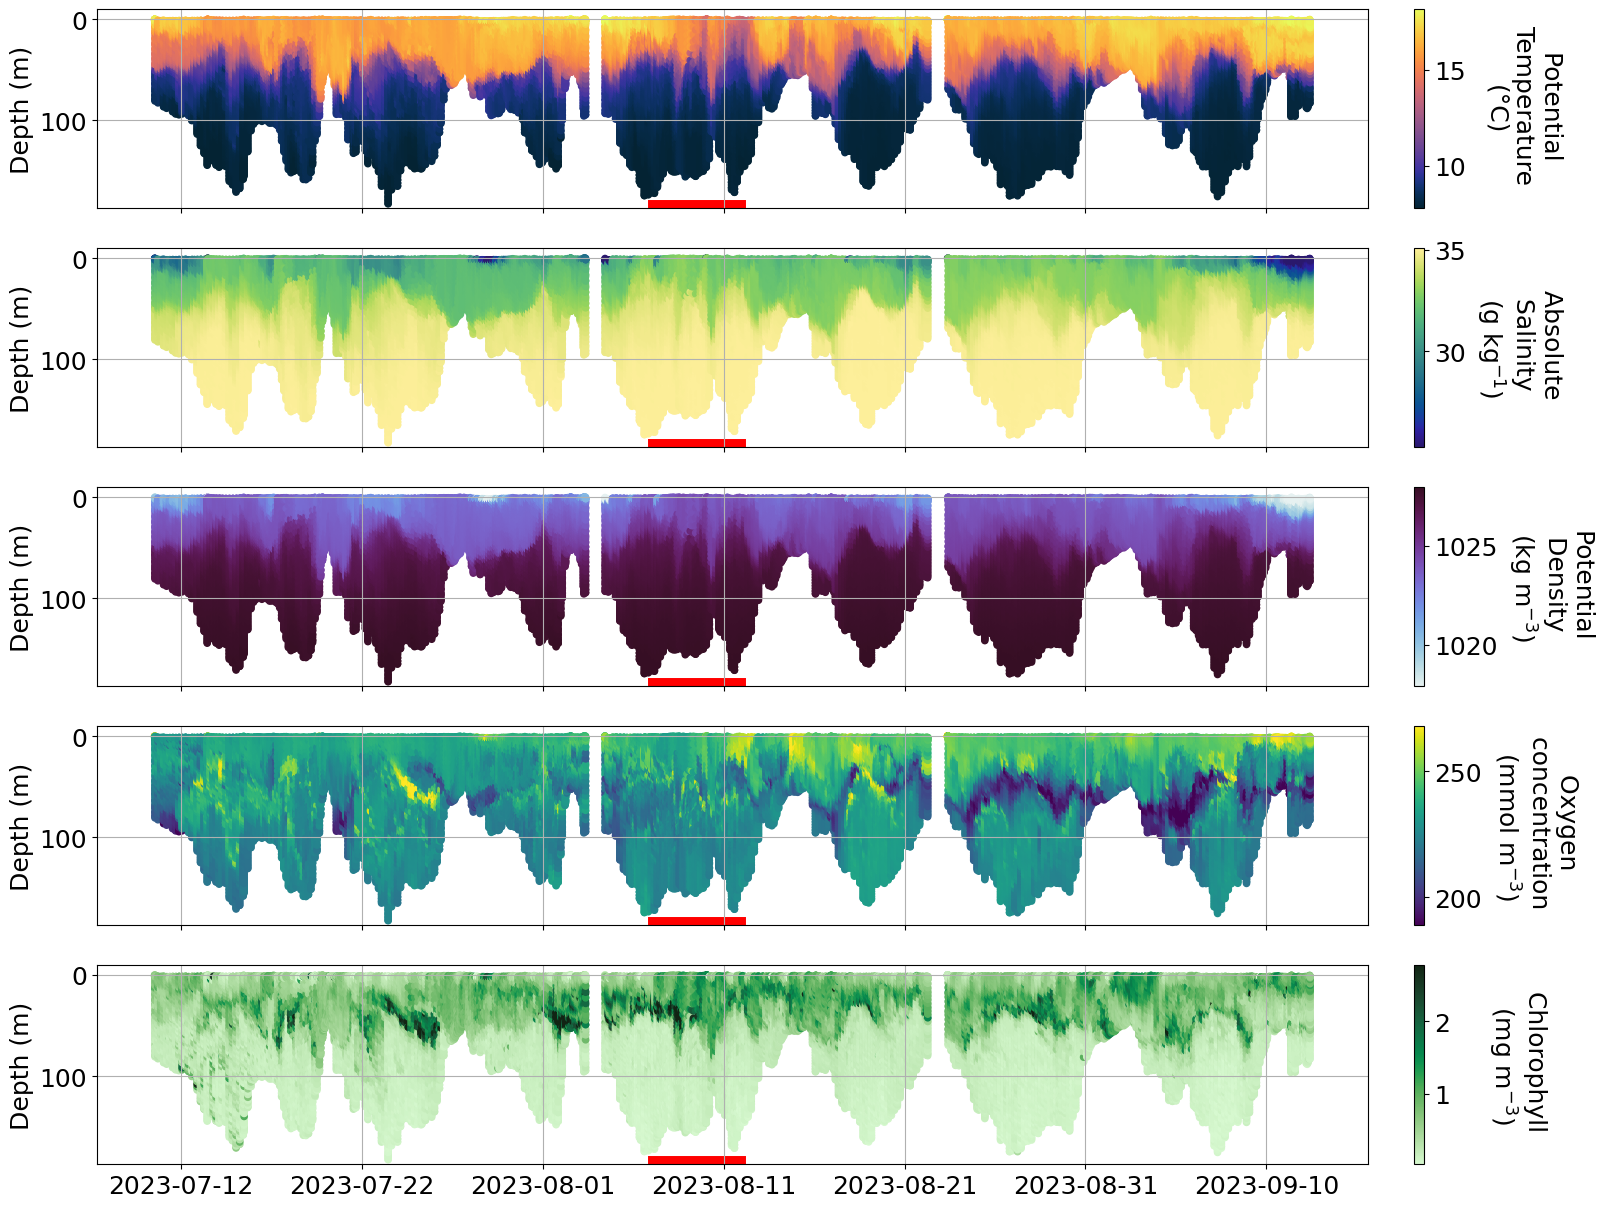
## Temperature and salinity for Western Gotland looks weird, let#s check if we see issues in the delayed mode data as well

#Uncomment this line
#plot_sel_data(basin='Western Gotland',date_start='2023-07-01', date_end='2023-09-01', delayed=True)
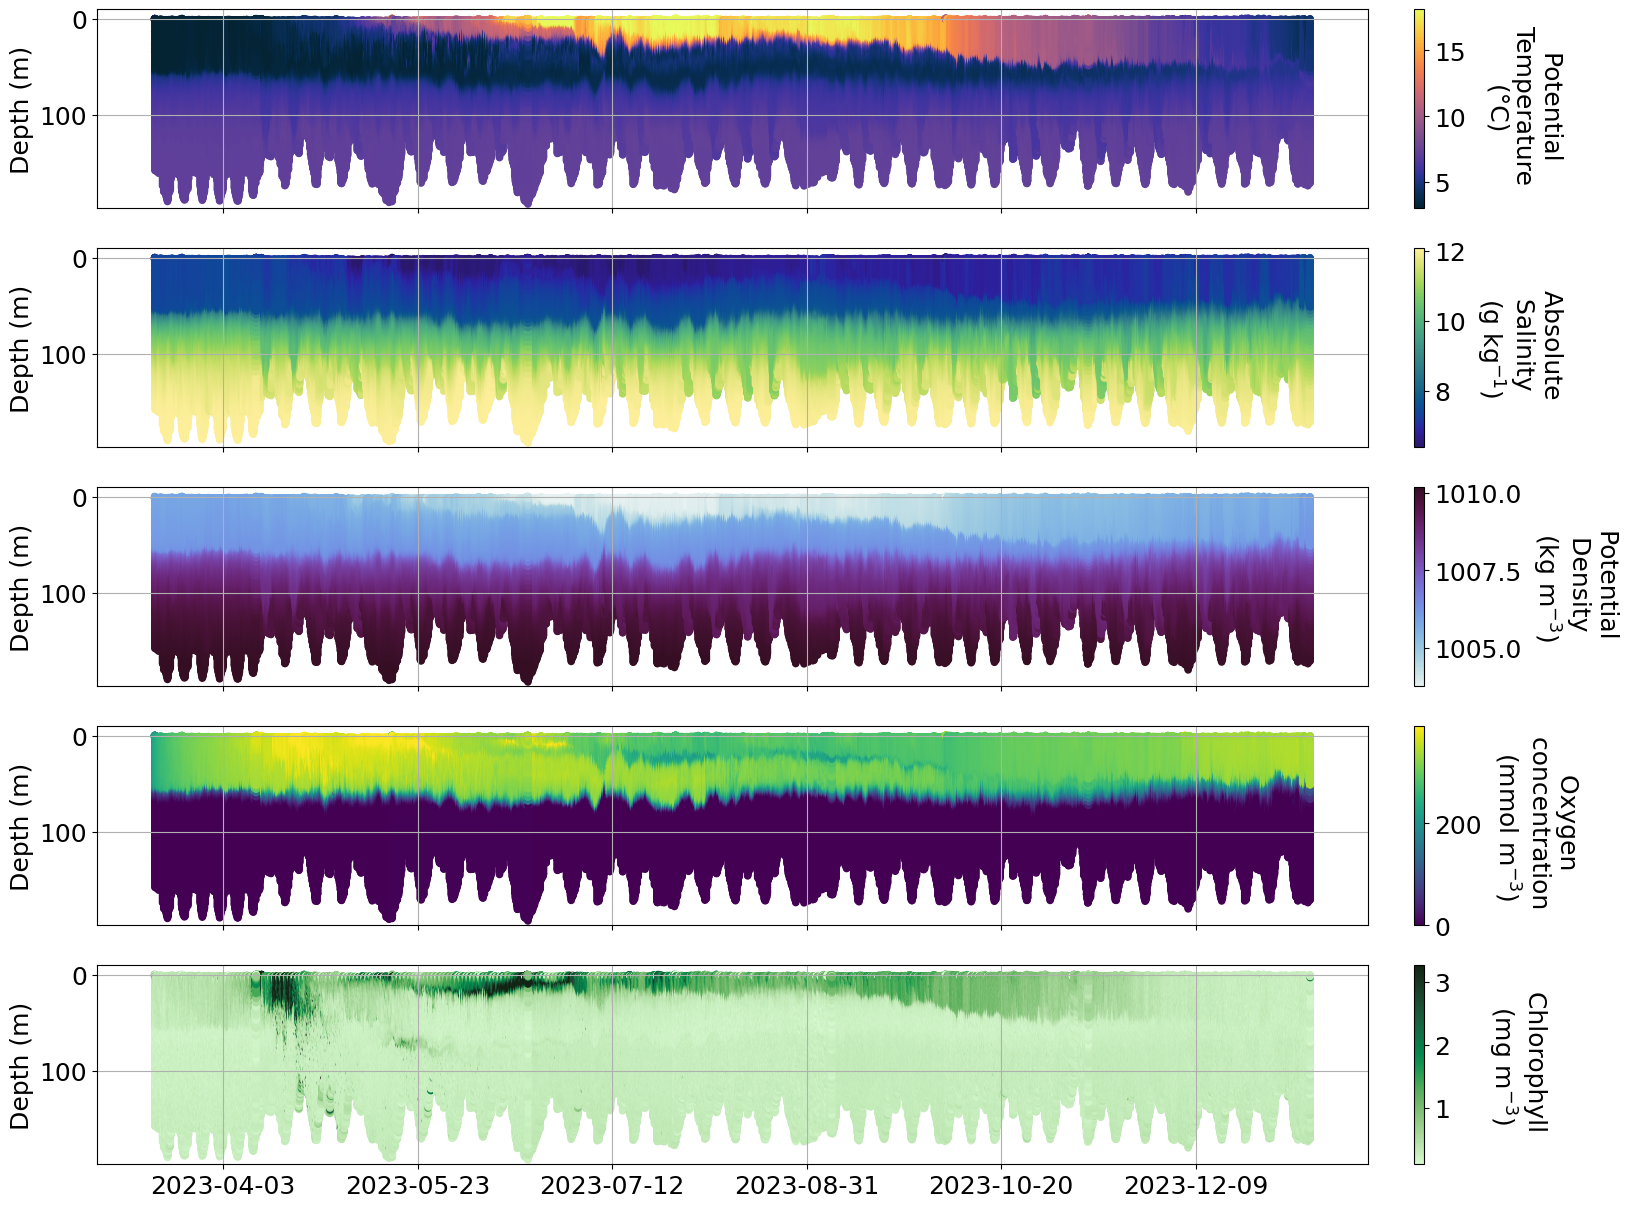
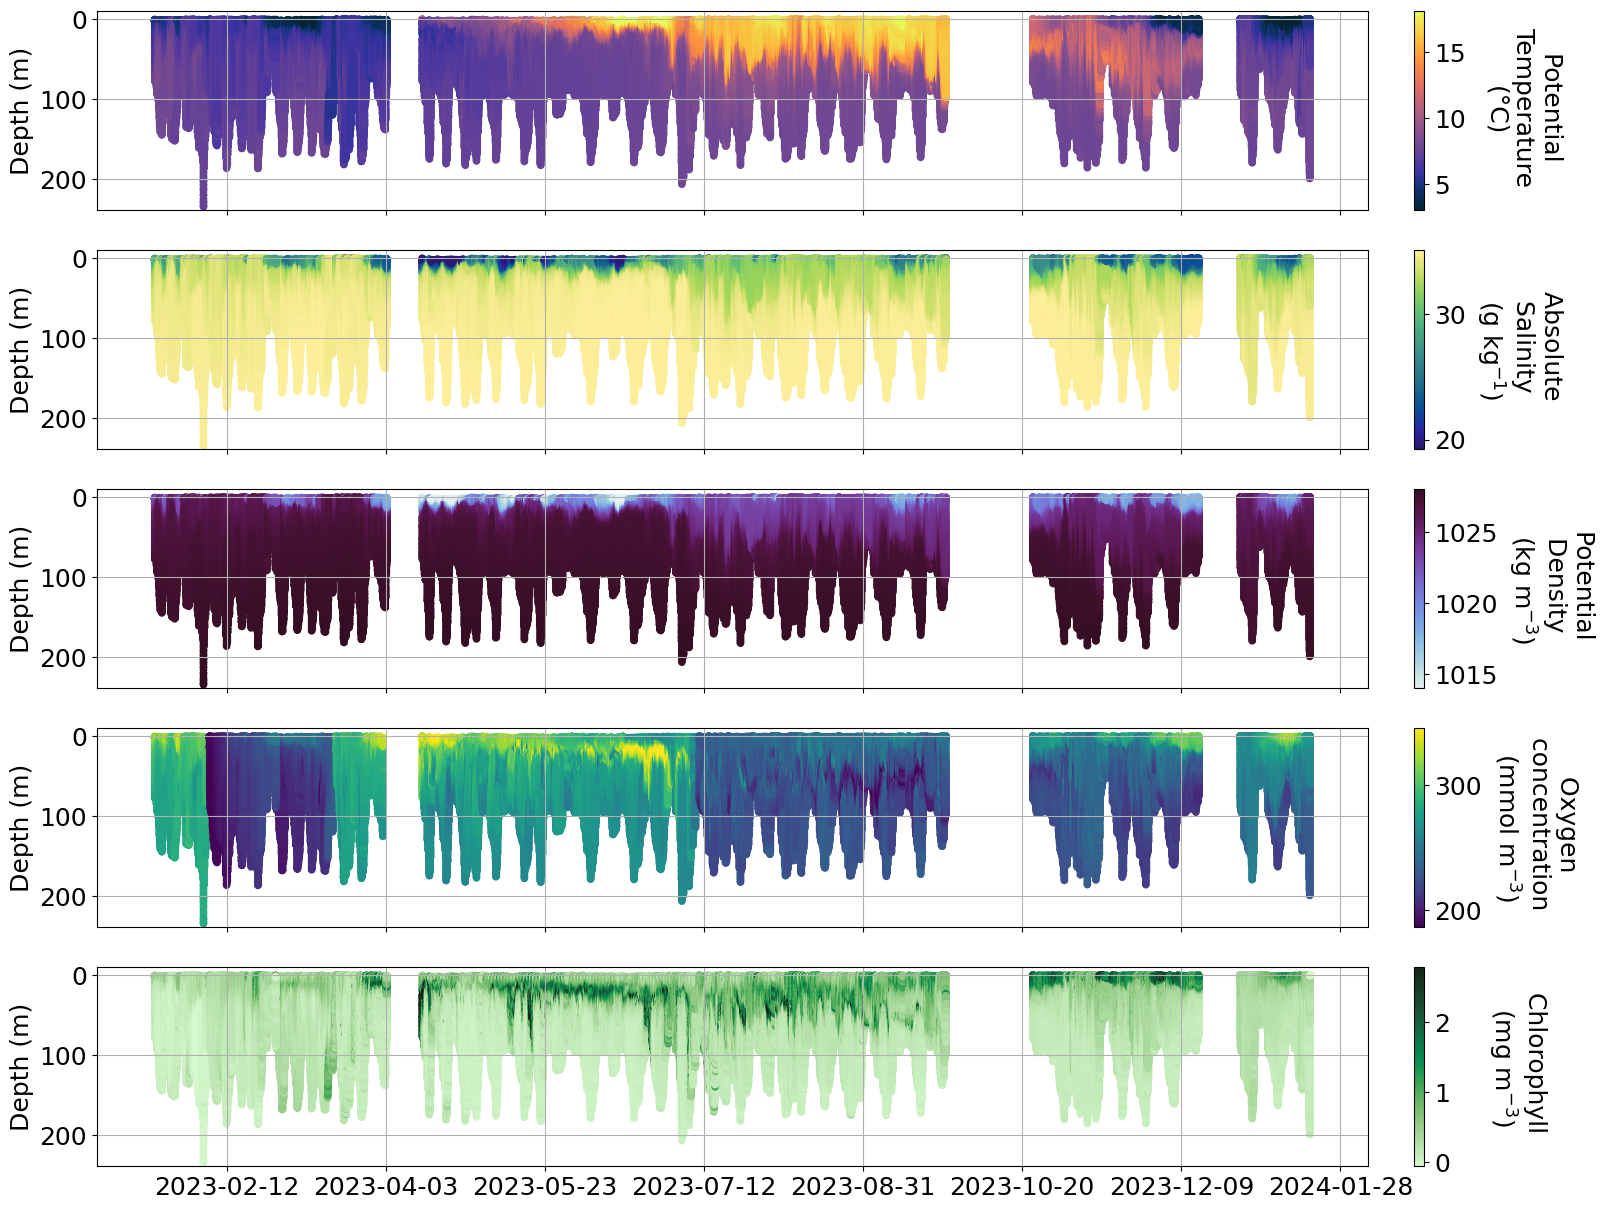
d. Spring blooms#
plot_sel_data(basin='Bornholm',date_start='2023-01-01', date_end='2024-01-01',rectangle=False)
0%| | 0/19 [00:00<?, ?it/s]
Downloading nrt_SEA069_M15
Downloading nrt_SEA045_M74
11%|████▊ | 2/19 [00:00<00:03, 4.51it/s]
Downloading nrt_SEA045_M75
16%|███████▎ | 3/19 [00:00<00:04, 3.29it/s]
Downloading nrt_SEA045_M79
21%|█████████▋ | 4/19 [00:01<00:05, 2.85it/s]
Downloading nrt_SEA063_M55
26%|████████████ | 5/19 [00:01<00:04, 2.86it/s]
Downloading nrt_SEA063_M60
32%|██████████████▌ | 6/19 [00:02<00:04, 2.82it/s]
Downloading nrt_SEA063_M62
Downloading nrt_SEA063_M63
Downloading nrt_SEA063_M65
47%|█████████████████████▊ | 9/19 [00:02<00:02, 4.15it/s]
Downloading nrt_SEA063_M67
53%|███████████████████████▋ | 10/19 [00:02<00:02, 3.61it/s]
Downloading nrt_SEA063_M69
Downloading nrt_SEA067_M41
63%|████████████████████████████▍ | 12/19 [00:03<00:01, 3.92it/s]
Downloading nrt_SEA067_M42
68%|██████████████████████████████▊ | 13/19 [00:03<00:01, 3.49it/s]
Downloading nrt_SEA067_M44
74%|█████████████████████████████████▏ | 14/19 [00:04<00:02, 2.40it/s]
Downloading nrt_SEA067_M46
Downloading nrt_SEA067_M51
Downloading nrt_SEA077_M18
89%|████████████████████████████████████████▎ | 17/19 [00:05<00:00, 3.43it/s]
Downloading nrt_SEA056_M64
95%|██████████████████████████████████████████▋ | 18/19 [00:05<00:00, 2.97it/s]
Downloading nrt_SEA056_M66
100%|█████████████████████████████████████████████| 19/19 [00:06<00:00, 3.16it/s]
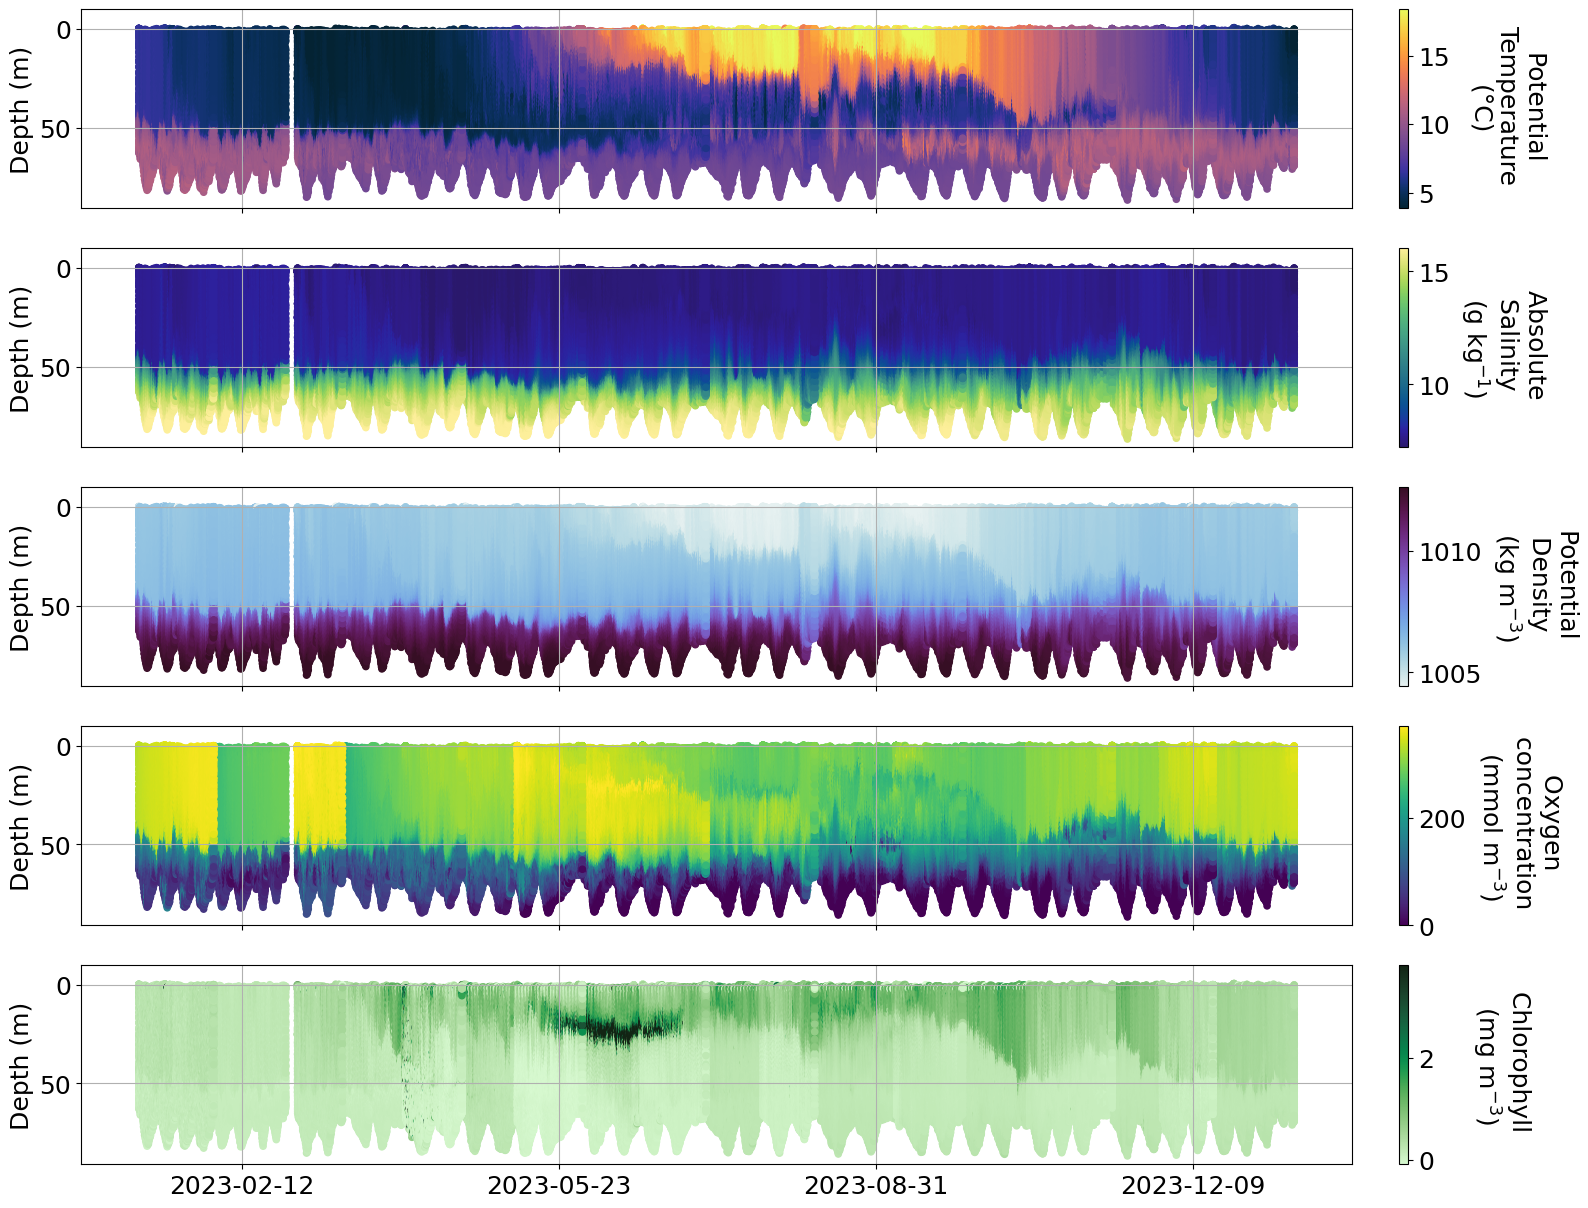
Info
There are issues with some of the oxygen data and more info can be found here https://observations.voiceoftheocean.org/static/img/reports/Quality_Issue_1_AROD.pdf
plot_sel_data(basin='Eastern Gotland',date_start='2023-01-01', date_end='2024-01-01',rectangle=False)
0%| | 0/9 [00:00<?, ?it/s]
Downloading nrt_SEA076_M16
11%|█████▏ | 1/9 [00:00<00:07, 1.08it/s]
Downloading nrt_SEA079_M12
22%|██████████▍ | 2/9 [00:01<00:06, 1.00it/s]
Downloading nrt_SEA079_M14
33%|███████████████▋ | 3/9 [00:02<00:05, 1.12it/s]
Downloading nrt_SEA079_M16
44%|████████████████████▉ | 4/9 [00:03<00:04, 1.19it/s]
Downloading nrt_SEA077_M21
56%|██████████████████████████ | 5/9 [00:04<00:03, 1.23it/s]
Downloading nrt_SEA077_M22
67%|███████████████████████████████▎ | 6/9 [00:05<00:02, 1.17it/s]
Downloading nrt_SEA077_M24
Downloading nrt_SEA077_M25
89%|█████████████████████████████████████████▊ | 8/9 [00:06<00:00, 1.54it/s]
Downloading nrt_SEA077_M28
100%|███████████████████████████████████████████████| 9/9 [00:06<00:00, 1.30it/s]
plot_sel_data(basin='Skagerrak',date_start='2023-01-01', date_end='2024-01-01',rectangle=False)
0%| | 0/16 [00:00<?, ?it/s]
Downloading nrt_SEA069_M19
6%|██▉ | 1/16 [00:00<00:06, 2.39it/s]
Downloading nrt_SEA069_M21
12%|█████▊ | 2/16 [00:00<00:05, 2.66it/s]
Downloading nrt_SEA069_M22
19%|████████▋ | 3/16 [00:01<00:04, 2.69it/s]
Downloading nrt_SEA069_M23
25%|███████████▌ | 4/16 [00:01<00:04, 2.56it/s]
Downloading nrt_SEA055_M54
31%|██████████████▍ | 5/16 [00:01<00:04, 2.56it/s]
Downloading nrt_SEA055_M56
38%|█████████████████▎ | 6/16 [00:02<00:03, 2.62it/s]
Downloading nrt_SEA044_M72
44%|████████████████████▏ | 7/16 [00:02<00:03, 2.61it/s]
Downloading nrt_SEA044_M75
50%|███████████████████████ | 8/16 [00:03<00:02, 2.68it/s]
Downloading nrt_SEA044_M77
56%|█████████████████████████▉ | 9/16 [00:03<00:02, 2.64it/s]
Downloading nrt_SEA044_M78
62%|████████████████████████████▏ | 10/16 [00:03<00:02, 2.49it/s]
Downloading nrt_SEA044_M79
69%|██████████████████████████████▉ | 11/16 [00:04<00:01, 2.53it/s]
Downloading nrt_SEA044_M81
75%|█████████████████████████████████▊ | 12/16 [00:04<00:01, 2.40it/s]
Downloading nrt_SEA044_M83
Downloading nrt_SEA044_M84
Downloading nrt_SEA044_M85
Downloading nrt_SEA044_M86
100%|█████████████████████████████████████████████| 16/16 [00:05<00:00, 3.13it/s]
e. Specific data with issues#
# SEA070 with pumped SeaBird CTD
name = ['delayed_SEA070_M15', 'delayed_SEA070_M15']
ds_delayed = utils.download_glider_dataset(name, nrt_only=False)
0%| | 0/2 [00:00<?, ?it/s]
Found delayed_SEA070_M15 in voto_erddap_data_cache. Loading from disk
50%|███████████████████████▌ | 1/2 [00:28<00:28, 28.12s/it]
Found delayed_SEA070_M15 in voto_erddap_data_cache. Loading from disk
100%|███████████████████████████████████████████████| 2/2 [00:29<00:00, 14.90s/it]
full_data = []
for i in range(len(name)):
    full_data.append(ds_delayed[name[i]])
full_data = xr.concat(full_data, dim= 'time')

fig, ax = plt.subplots(5,1,figsize=(20, 15), sharex=True)
matplotlib.rcParams.update({'font.size': 18})
time=mdates.date2num(full_data.time)
t=ax[0].scatter( time,full_data.depth, c=full_data.temperature,s=20, cmap=cmo.thermal, vmin=np.nanpercentile(full_data.temperature, 0.5), vmax=np.nanpercentile(full_data.temperature, 99.5))
s=ax[1].scatter( time,full_data.depth, c=full_data.salinity,s=20,cmap=cmo.haline, vmin=np.nanpercentile(full_data.salinity, 0.5), vmax=np.nanpercentile(full_data.salinity, 99.5))
d=ax[2].scatter( time,full_data.depth, c=full_data.density, s=20, cmap=cmo.dense, vmin=np.nanpercentile(full_data.density, 0.5), vmax=np.nanpercentile(full_data.density, 99.5))
o=ax[3].scatter( time,full_data.depth, c=full_data.oxygen_frequency, s=20,vmin=np.nanpercentile(full_data.oxygen_frequency, 0.5), vmax=np.nanpercentile(full_data.oxygen_frequency, 99.5))
c=ax[4].scatter( time,full_data.depth, c=full_data.chlorophyll, s=20, cmap=cmo.algae, vmin=np.nanpercentile(full_data.chlorophyll, 0.5), vmax=np.nanpercentile(full_data.chlorophyll, 99.5))

[a.set_ylim(int(full_data.depth.max()+10),-10) for a in ax]
[a.grid() for a in ax]
ax[1].xaxis.reset_ticks()
ax[1].xaxis.set_major_locator(mdates.WeekdayLocator(byweekday = 1, interval=3))
ax[1].xaxis.set_major_formatter(mdates.DateFormatter('%Y-%m-%d'))


cbarT=plt.colorbar(t, ax=ax[0], pad = 0.03)
cbarT.set_label('Potential \nTemperature \n(°C)',labelpad=70, y=0.5, rotation=270,fontsize=18)
cbarS=plt.colorbar(s, ax=ax[1], pad = 0.03)
cbarS.set_label('Absolute \nSalinity \n(g kg$^{-1}$)',labelpad=70, y=0.5, rotation=270,fontsize=18)
cbarD=plt.colorbar(d, ax=ax[2], pad = 0.03)
cbarD.set_label('Potential \nDensity \n(kg m$^{-3}$)',labelpad=70, y=0.5, rotation=270,fontsize=18)
cbarO=plt.colorbar(o, ax=ax[3], pad = 0.03)
cbarO.set_label('Oxygen \nconcentration \n(mmol m$^{-3}$)',labelpad=70, y=0.5, rotation=270,fontsize=18)
cbarC=plt.colorbar(c, ax=ax[4], pad = 0.03)
cbarC.set_label('Chlorophyll \n(mg m$^{-3}$)',labelpad=70, y=0.5, rotation=270,fontsize=18)

[a.tick_params(axis='both', which='major', labelsize=18) for a in ax]
[a.set_ylabel('Depth (m)',fontsize=18) for a in ax]
[Text(0, 0.5, 'Depth (m)'),
 Text(0, 0.5, 'Depth (m)'),
 Text(0, 0.5, 'Depth (m)'),
 Text(0, 0.5, 'Depth (m)'),
 Text(0, 0.5, 'Depth (m)')]
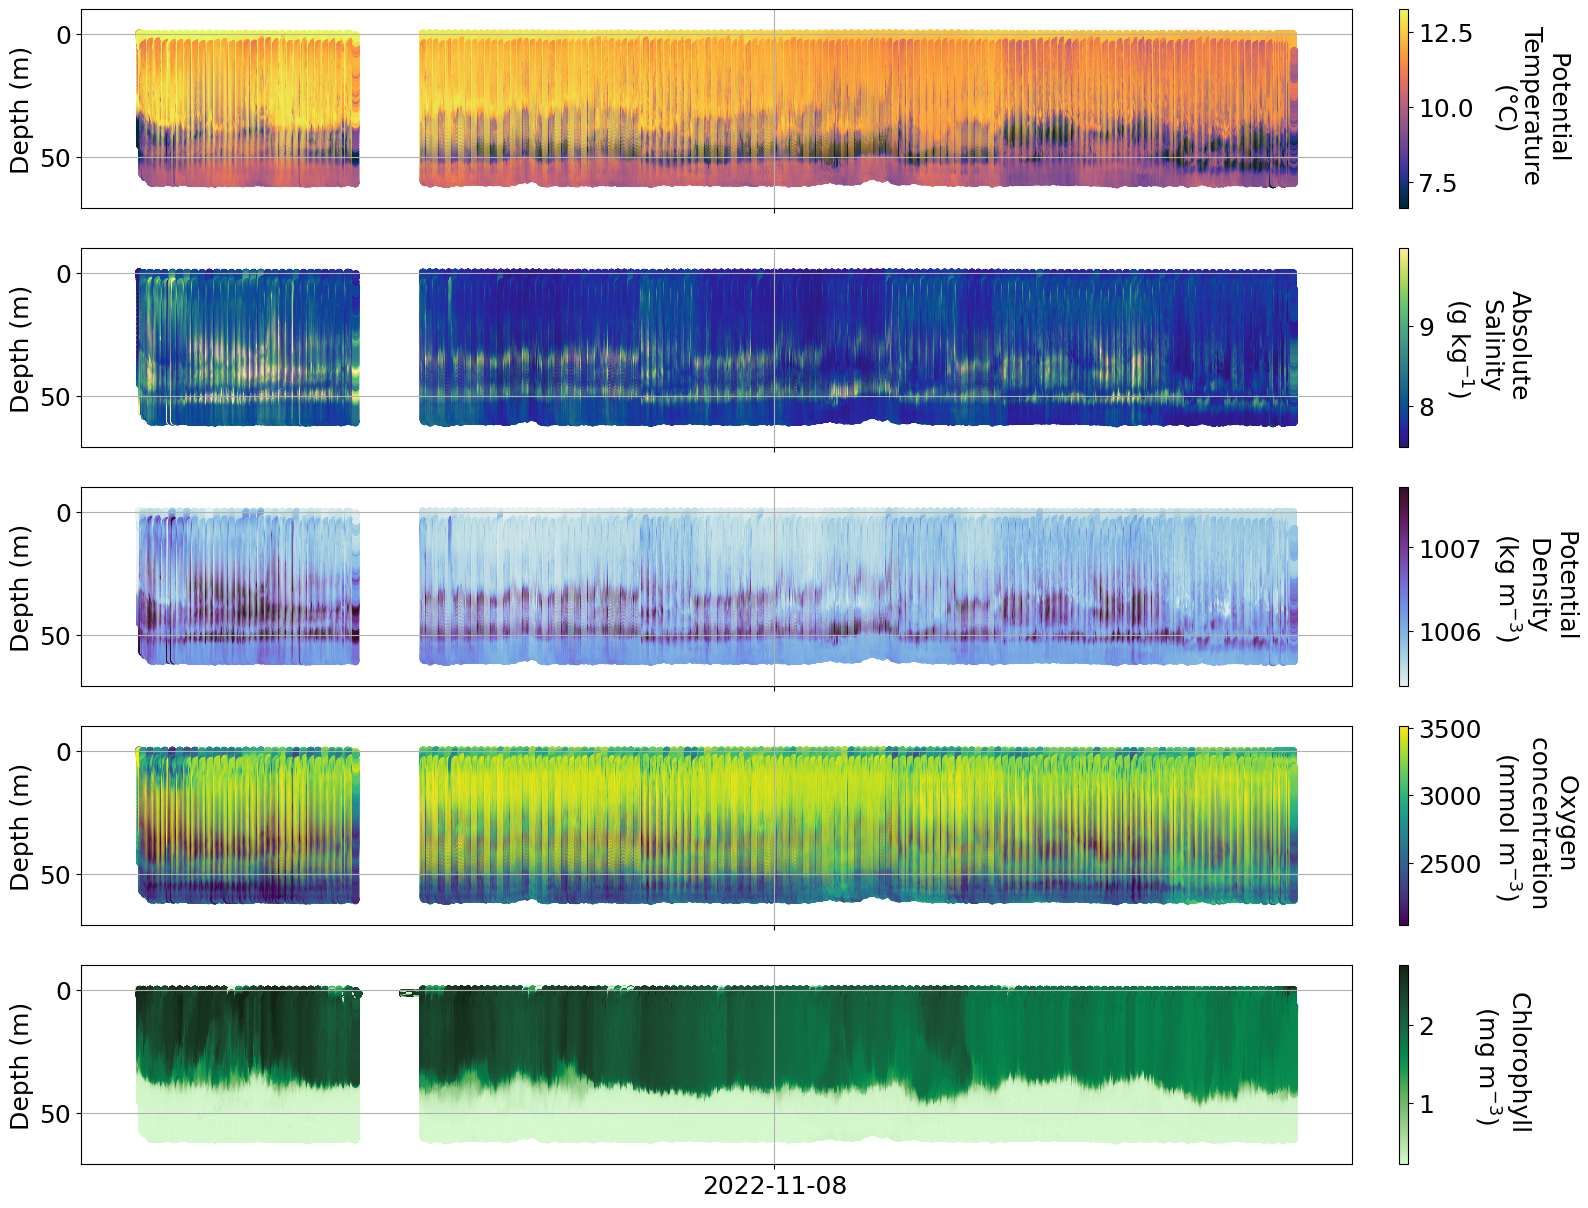
Note on Raw data#
These are all raw data and many adjustments have to be applied and various issues/sources should be considered. These include:
Thermal hysteresis
Quenching corrections
Calibration (ex. optics dark count correction and scaling factor correction, oxygen calibration etc..)
Electrical spikes
Outliers
Sensor failure
Specific sensor issues (FLBBPC issues, FLBBCD issues, AROD and CODA issues)
other?
4. Your turn#
Create a new notebook to work with just one of these datasets.
Pick a dataset, and copy the code from this notebook into your new notebook to load the data.
Repeat some of the basic plots.
Explore how to make a section plot from the glider data for a specific variable only.
Can you make another plot type? Maybe a T-S plot, or a T-S plot coloured by oxygen (or chlorophyll fluorescence). Or a profile plot.
